d o t o r e g . c o m
Dr. Mete ALPASLAN
Left Bundle Branch Block - LBBB
Diagnostic criteria
 The QRS width should be greater than or equal to
- 120 ms in adults,
- 100 ms in children of 4-16 years,
- 90 ms in children under 4 years of age.
Wide, notched R wave in leads I, aVL, V5 and V6. Occasionally, RS pattern may be seen in leads V5 and V6.
q waves are absent in leads I, V5 and V6. A small q wave may be present in lead aVL.
ST and T wave are generally opposite in direction to QRS.
Positive T waves in leads with positive QRS may be normal (positive concordance).
Depressed ST segment and/or negative T wave in leads with negative QRS (negative concordance) are abnormal.
Development of LBBB may change mean QRS axis to right or to left. This change may be in a rate-dependent manner.
R peak time is >60ms in leads V5 and V6. If there are small r waves in leads V1, V2 or V3, the R peak time may be normal in these leads.
Clinical significance
In patients with preexisting bundle branch block, development of supraventricular tachycardia may resemble ventricular tachycardia at first glance.
In patients with preexisting bundle branch block, development of atrial flutter with a 1 to 1 conduction to the ventricles may resemble ventricular tachycardia at first glance.
A recent retrospective study examined 152,479 patients who underwent noncardiac surgery. It was concluded that patients with preoperative intraventricular conduction defect (including left bundle branch block) are not at greater risk of postoperative in-hospital death or postoperative myocardial infarction compared with patients with other ECG abnormalities.
LBBB pattern - Incomplete LBBB
QRS duration is between
- 110-119 ms in adults,
- 90-100 ms in children between 4-16 years old,
- 80-90 ms in children between 0-4 years of age.
There is left ventricular hypertrophy pattern.
q waves are absent in leads I, V5, and V6.
R peak time is >60 ms in leads V4, V5, and V6.
LBBB and acute myocardial infarction
Diagnosis of acute myocardial infarction in patients wih LBBB is generally not easy. In patients with clinical findings suggestive of acute myocardial infarction, observation of the following ECG findings may help in diagnosing the acute myocardial infarction.
Concordant (with the QRS complex) ST segment elevation of at least 1mm (most important criteria).
1 mm or more ST segment depression in leads C1, C2 or C3.
At least 5mm or more ST segment elevation which is discordant with the QRS complex.
Cabrera's sign: Notching 0.04 second in duration in the ascending limb of the S wave of leads C3 or C4.
Chapman's sign: Notching of the upstroke of the R wave in leads I, aVL, or V6. (Chapman's sign may also be seen in some patients with Dilated CardioMyoPathy).
The presence of rS configuration in lead C6.
Positive T waves in leads with positive QRS complex.
Below, the ECGs 4a and 4b clearly demonstrate how LBBB can mask the signs of ischemia during myocardial infarction.
Clinical significance
A recent retrospective study examined 152,479 patients who underwent noncardiac surgery. It was concluded that patients with preoperative intraventricular conduction defect
(including left bundle branch block) are not at greater risk of postoperative in-hospital death or postoperative myocardial infarction compared with patients with other ECG abnormalities.
References
Am J Cardiol 2018;121(8):997-1003.
Circulation 2009;119:e235-e240 .
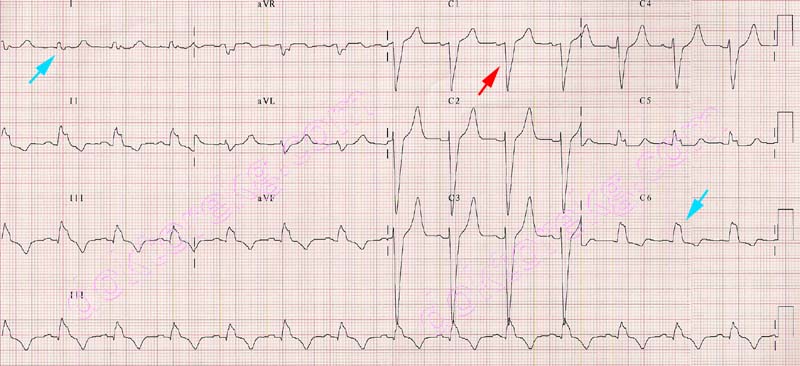
ECG 1. Left bundle branch block. RR' in I and C6 , deep and wide S wave in C1 is seen.
Click here for a more detailed ECG

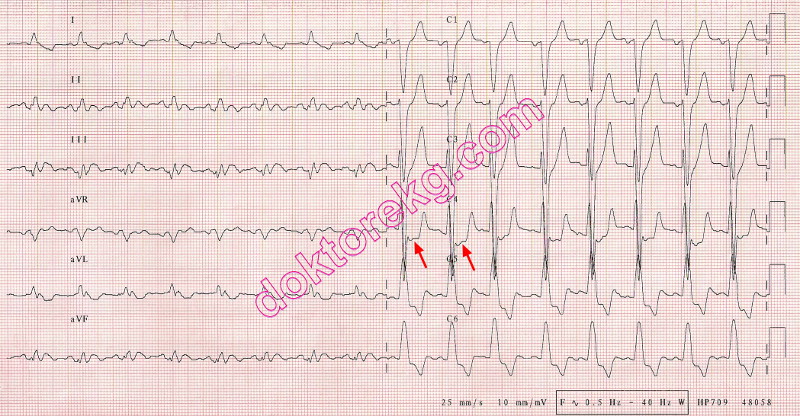
ECG 2. Left bundle branch block in another patient. This subject also has mitral stenosis.
The notched P wave in lead II suggests left atrial abnormality.
Click here for a more detailed ECG

ECG 3. Left bundle branch block pattern in a patient with systemic hypertension. The 4th and 5th beats from the left side
make the ventricular couplet.
Click here for a more detailed ECG

ECG 4a. The above ECG is from an 80 years-old woman with chest pain and acute non-ST elevation myocardial infarction.
It shows signs of myocardial ischemia: negative T waves and ST segment depression in anterior leads.
The heart rate is about 81/minute
Click here for a more detailed ECG

ECG 4b. When the heart rate increased slightly up to 88/minute, rate-dependent left bundle branch block appeared and
masked the electrocardiographic signs of myocardial ischemia.
Click here for a more detailed ECG

Figure 1. Her coronary angiography showed significant stenoses in the
LAD ( Left Anterior Descending ) and Cx ( CircumfleX ) coronary arteries.

ECG 5a. The ECG above belongs to a 25 years-old puerpera (one day after childbirth). Atrial bigeminy is seen.
Every P wave originating from the sinus node is followed by a premature
P wave originating from an ectopic focus in the atria.
The premature P wave is negative in the above ECG, suggesting a low atrial focus.
However, all atrial premature beats should NOT necessarily be negative.
Negativity of the P wave is related to its focus, but not to its prematurity.
Click here for a more detailed ECG

ECG 5b. A few hours later, her ECG shows that atrial premature contractions are now coming earlier and being conducted with
aberration. Some P waves are conducted normally to the ventricles . Some premature P waves are conducted with left
anterior fascicular block (LAFB) while some others are conducted with left bundle branch block (LBBB) morphology.
Click here for a more detailed ECG

ECG 6. Coexistence of left bundle branch block and atrial fibrillation.
Click here for a more detailed ECG

ECG 7. Cabrera's sign and LBBB. The rhythm is atrial fibrillation.
Click here for a more detailed ECG

ECG 8. The ECG above was recorded immediately after implantation of a stent to the LAD coronary artery for acute anterior
myocardial infarction.
LBBB is accompanied by the Cabrera's sign.
Baseline drift artifact is also seen.
Click here for a more detailed ECG
ECG 9. The ECG above is from a middle-aged man experiencing acute myocardial infarction.
It was recorded just before stenting of the Circumflex (Cx) coronary artery.
LBBB is accompanied by the Cabrera's sign.
Click here for a more detailed ECG
ECG 10. By definition, some patients with LBBB may have an RS pattern in lead V6. RR' pattern in lead V6 is not a necessity.
The compact ECG above is from a 73 years-old man with a history of old anterior myocardial infarction and coronary artery
bypass graft surgery. He has severe left ventricular systolic dysfunction (with an Ejection Fraction of 23%).

ECG 11. The ECG above is from a 56 yers-old woman with minimal coronary artery disease, and
left ventricular systolic dysfunction and dilation (Dilated CardioMyoPathy with an Ejection Fraction of 25%).
Notch in the ascending limb of the R wave in lead aVL denotes Chapman's sign.
Chapman's sign may also be seen in some patients with Dilated CardioMyoPathy and LBBB.
ECG 12. The ECG above is from a 79 years-old woman with long-standing hypertension.
Left bundle branch block is seen.
ECHOcardiography showed diffuse (concentric) left ventricular hypertrophy.
Click here for a more detailed ECG

ECG 13. The ECG above is from a 40 years-old woman.
Sinus rhythm, left bundle branch block, short PR interval and delta waves (WPW syndrome) are seen.
Click here for a more detailed ECG

ECG 14a. The ECG above belongs to a 48 years-old man. He had undergone Bentall operation 5 days ago.
Wide-QRS tachycardia in the form of left bundle branch block is seen. Is it ventricular tachycardia (VT ?)
Dr. Erkan Kısacık has donated the above ECG to our website.
Click here for a more detailed ECG

ECG 14b. The ECG above belongs to the same patient. It was recorded after electrical cardioversion with 50 Joules.
Now, the rhythm is sinus. Left bundle branch block is also seen.
Later on, electrophysiologic study (EPS) revealed atrial flutter with 1:1 conduction.
The ECG 22a was actually atrial flutter with a 1:1 conduction to the ventricles.
Every wide QRS tachycardia is not necessarily a VT.
Dr. Sinan Altan Kocaman has donated the above ECG to our website.
Click here for a more detailed ECG

ECG 15. The ECG above is from a 77 years-old woman with left ventricular systolic dysfunction and mild mitral valve stenosis.
The rhythm is atrial fibrillation. Left bundle branch block is also seen.
Click here for a more detailed ECG
The QRS width should be greater than or equal to
- 120 ms in adults,
- 100 ms in children of 4-16 years,
- 90 ms in children under 4 years of age.
Wide, notched R wave in leads I, aVL, V5 and V6. Occasionally, RS pattern may be seen in leads V5 and V6.
q waves are absent in leads I, V5 and V6. A small q wave may be present in lead aVL.
ST and T wave are generally opposite in direction to QRS.
Positive T waves in leads with positive QRS may be normal (positive concordance).
Depressed ST segment and/or negative T wave in leads with negative QRS (negative concordance) are abnormal.
Development of LBBB may change mean QRS axis to right or to left. This change may be in a rate-dependent manner.
R peak time is >60ms in leads V5 and V6. If there are small r waves in leads V1, V2 or V3, the R peak time may be normal in these leads.
Clinical significance
In patients with preexisting bundle branch block, development of supraventricular tachycardia may resemble ventricular tachycardia at first glance.
In patients with preexisting bundle branch block, development of atrial flutter with a 1 to 1 conduction to the ventricles may resemble ventricular tachycardia at first glance.
A recent retrospective study examined 152,479 patients who underwent noncardiac surgery. It was concluded that patients with preoperative intraventricular conduction defect (including left bundle branch block) are not at greater risk of postoperative in-hospital death or postoperative myocardial infarction compared with patients with other ECG abnormalities.
LBBB pattern - Incomplete LBBB
QRS duration is between
- 110-119 ms in adults,
- 90-100 ms in children between 4-16 years old,
- 80-90 ms in children between 0-4 years of age.
There is left ventricular hypertrophy pattern.
q waves are absent in leads I, V5, and V6.
R peak time is >60 ms in leads V4, V5, and V6.
LBBB and acute myocardial infarction
Diagnosis of acute myocardial infarction in patients wih LBBB is generally not easy. In patients with clinical findings suggestive of acute myocardial infarction, observation of the following ECG findings may help in diagnosing the acute myocardial infarction.
Concordant (with the QRS complex) ST segment elevation of at least 1mm (most important criteria).
1 mm or more ST segment depression in leads C1, C2 or C3.
At least 5mm or more ST segment elevation which is discordant with the QRS complex.
Cabrera's sign: Notching 0.04 second in duration in the ascending limb of the S wave of leads C3 or C4.
Chapman's sign: Notching of the upstroke of the R wave in leads I, aVL, or V6. (Chapman's sign may also be seen in some patients with Dilated CardioMyoPathy).
The presence of rS configuration in lead C6.
Positive T waves in leads with positive QRS complex.
Below, the ECGs 4a and 4b clearly demonstrate how LBBB can mask the signs of ischemia during myocardial infarction.
Clinical significance
A recent retrospective study examined 152,479 patients who underwent noncardiac surgery. It was concluded that patients with preoperative intraventricular conduction defect
(including left bundle branch block) are not at greater risk of postoperative in-hospital death or postoperative myocardial infarction compared with patients with other ECG abnormalities.
References
Am J Cardiol 2018;121(8):997-1003.
Circulation 2009;119:e235-e240 .
ECG 1. Left bundle branch block. RR' in I and C6 , deep and wide S wave in C1 is seen.
Click here for a more detailed ECG
ECG 2. Left bundle branch block in another patient. This subject also has mitral stenosis.
The notched P wave in lead II suggests left atrial abnormality.
Click here for a more detailed ECG
ECG 3. Left bundle branch block pattern in a patient with systemic hypertension. The 4th and 5th beats from the left side
make the ventricular couplet.
Click here for a more detailed ECG
ECG 4a. The above ECG is from an 80 years-old woman with chest pain and acute non-ST elevation myocardial infarction.
It shows signs of myocardial ischemia: negative T waves and ST segment depression in anterior leads.
The heart rate is about 81/minute
Click here for a more detailed ECG
ECG 4b. When the heart rate increased slightly up to 88/minute, rate-dependent left bundle branch block appeared and
masked the electrocardiographic signs of myocardial ischemia.
Click here for a more detailed ECG
Figure 1. Her coronary angiography showed significant stenoses in the
LAD ( Left Anterior Descending ) and Cx ( CircumfleX ) coronary arteries.
ECG 5a. The ECG above belongs to a 25 years-old puerpera (one day after childbirth). Atrial bigeminy is seen.
Every P wave originating from the sinus node is followed by a premature
P wave originating from an ectopic focus in the atria.
The premature P wave is negative in the above ECG, suggesting a low atrial focus.
However, all atrial premature beats should NOT necessarily be negative.
Negativity of the P wave is related to its focus, but not to its prematurity.
Click here for a more detailed ECG
ECG 5b. A few hours later, her ECG shows that atrial premature contractions are now coming earlier and being conducted with
aberration. Some P waves are conducted normally to the ventricles . Some premature P waves are conducted with left
anterior fascicular block (LAFB) while some others are conducted with left bundle branch block (LBBB) morphology.
Click here for a more detailed ECG
ECG 6. Coexistence of left bundle branch block and atrial fibrillation.
Click here for a more detailed ECG
ECG 7. Cabrera's sign and LBBB. The rhythm is atrial fibrillation.
Click here for a more detailed ECG
ECG 8. The ECG above was recorded immediately after implantation of a stent to the LAD coronary artery for acute anterior
myocardial infarction.
LBBB is accompanied by the Cabrera's sign.
Baseline drift artifact is also seen.
Click here for a more detailed ECG
ECG 9. The ECG above is from a middle-aged man experiencing acute myocardial infarction.
It was recorded just before stenting of the Circumflex (Cx) coronary artery.
LBBB is accompanied by the Cabrera's sign.
Click here for a more detailed ECG
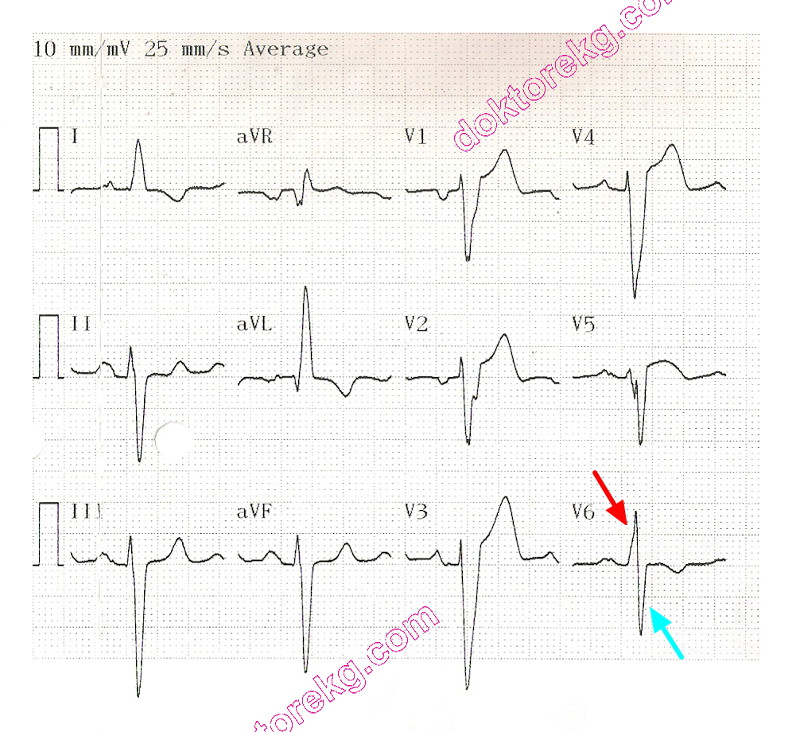
ECG 10. By definition, some patients with LBBB may have an RS pattern in lead V6. RR' pattern in lead V6 is not a necessity.
The compact ECG above is from a 73 years-old man with a history of old anterior myocardial infarction and coronary artery
bypass graft surgery. He has severe left ventricular systolic dysfunction (with an Ejection Fraction of 23%).
ECG 11. The ECG above is from a 56 yers-old woman with minimal coronary artery disease, and
left ventricular systolic dysfunction and dilation (Dilated CardioMyoPathy with an Ejection Fraction of 25%).
Notch in the ascending limb of the R wave in lead aVL denotes Chapman's sign.
Chapman's sign may also be seen in some patients with Dilated CardioMyoPathy and LBBB.
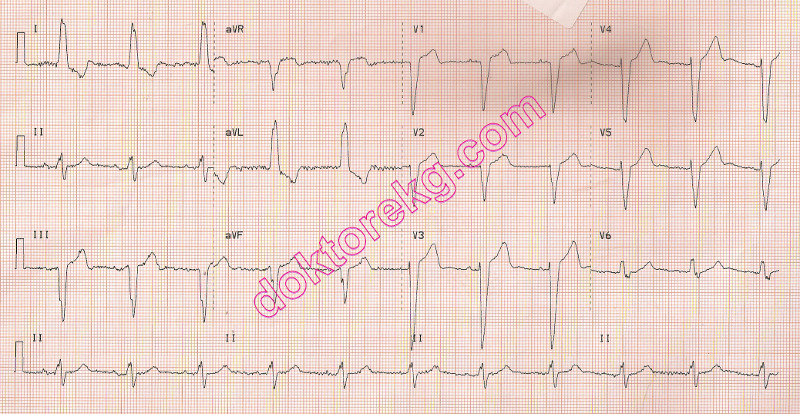
ECG 12. The ECG above is from a 79 years-old woman with long-standing hypertension.
Left bundle branch block is seen.
ECHOcardiography showed diffuse (concentric) left ventricular hypertrophy.
Click here for a more detailed ECG
ECG 13. The ECG above is from a 40 years-old woman.
Sinus rhythm, left bundle branch block, short PR interval and delta waves (WPW syndrome) are seen.
Click here for a more detailed ECG
ECG 14a. The ECG above belongs to a 48 years-old man. He had undergone Bentall operation 5 days ago.
Wide-QRS tachycardia in the form of left bundle branch block is seen. Is it ventricular tachycardia (VT ?)
Dr. Erkan Kısacık has donated the above ECG to our website.
Click here for a more detailed ECG
ECG 14b. The ECG above belongs to the same patient. It was recorded after electrical cardioversion with 50 Joules.
Now, the rhythm is sinus. Left bundle branch block is also seen.
Later on, electrophysiologic study (EPS) revealed atrial flutter with 1:1 conduction.
The ECG 22a was actually atrial flutter with a 1:1 conduction to the ventricles.
Every wide QRS tachycardia is not necessarily a VT.
Dr. Sinan Altan Kocaman has donated the above ECG to our website.
Click here for a more detailed ECG
ECG 15. The ECG above is from a 77 years-old woman with left ventricular systolic dysfunction and mild mitral valve stenosis.
The rhythm is atrial fibrillation. Left bundle branch block is also seen.
Click here for a more detailed ECG