d o t o r e g . c o m
Dr. Mete ALPASLAN
Myocarditis and the ECG
 There is no electrocardiographic sign specific to myocarditis.
Generally pericarditis accompanies the myocarditis.
A normal ECG does not exclude the diagnosis of myocarditis.
ECG abnormalities that may be observed in patients with myocarditis / myopericarditis
Sinus tachycardia
Diffuse T wave inversion
Atrioventricular (AV) blocks
QT interval prolongation
Bundle branch blocks
Ventricular arrhythmias
Abnormal (pathological) Q waves
ST segment elevation mimicking acute myocardial infarction (rare)
Sick sinus syndrome (rare)
ECG and prognosis in myocarditis
A gradual increase in the width of QRS complex is suggested as a sign of exacerbation of myocarditis.
Prolonged QRS duration is suggested as an independent predictor for cardiac death or heart transplantation in patients with suspected myocarditis.
References
Anadolu Kardiyol Derg 2012;12:279-280 .
Tex Heart Inst J 2011;38:288-290.
Circ J 2011;75:932-938.
Can J Cardiol 2011;27:870.e1-3. Epub 2011 Oct 15
Cardiol J 2011;18:552-555.
Circ J 2011;75:734-743.
Eur J Heart Fail 2011;13:398-405.
Int J Cardiol 2011 Aug 31. [Epub ahead of print]. DOI: http://dx.doi.org/10.1016/j.ijcard.2011.07.090
Am Heart Journal 1994;127:1290.

ECG 1. The ECG above belongs to a 34 years-old woman who was diagnosed as having diphtheria myocarditis.
ST segment is elevated in leads III, aVR, and V1 while it is depressed in other leads. A VPC is also seen.
Complete AV block developes after the VPC and nodal rhythm with P waves unrelated to the QRS complexes
(the last two beats) ensues.
Click here for a more detailed ECG
The ECG above has been used with the permission of Anatolian Journal of Cardiology and AVES Publishing.
Click here to read the relevant article of Dr. Ornek et al.

ECG 2. The ECG above belongs to a 20 years-old man who had developed myopericarditis after inhalation of the butane gas.
Widespread ST segment elevation is seen.
His cardiac Troponin I level increased up to 3.5 ng/mL. Coronary angiography revealed normal coronary arteries.
Click here for a more detailed ECG
The ECG above has been used with the permission of Anatolian Journal of Cardiology and AVES Publishing.
Click here to read the relevant article of Dr. Bayar et al.

ECG 3a. The ECG above is from a 17 years-old boy with varicella infection, severe chest pain and elevated cardiac enzymes.
The ST segment elevation in leads I, aVL, V4 to V6 suggests acute myocardial infarction at first glance.
His coronary angiography showed normal coronary arteries and varicella myopericarditis was diagnosed.
The ECG above has been used with the permission of Texas Heart Institute Journal.
Click here for a more detailed ECG
Click here to go to the relevant article of the Texas Heart Institute Journal

ECG 3b. His ECG at 5th day of hospitalization (before discharge) is seen above.
ST segments are nearly normal.
The ECG above has been used with the permission of Texas Heart Institute Journal.
Click here for a more detailed ECG
Click here to go to the relevant article of the Texas Heart Institute Journal
ECG 3c. Above is his ECG after 2 weeks. Negative T waves are seen in leads V3 to V6.
The ECG above has been used with the permission of Texas Heart Institute Journal.
Click here for a more detailed ECG
Click here to go to the relevant article of the Texas Heart Institute Journal

ECG 4a. The ECG above is from a 25 years-old man with chest pain and elevated cardiac enzymes.
At first glance, the ST segment elevation and T wave negativity in chest leads may suggest myocardial infarction.
Coronary angiography showed normal coronary arteries and myocarditis was diagnosed in this patient.
ECHOcardiography showed mild left ventricular systolic dysfunction.
Click here for a more detailed ECG

ECG 4b. Above is his ECG which was recorded 2 months later.
Chest leads show ST segment elevation (albeit less prominent) and negative T waves.
Repeated ECHOcardiography again showed mild left ventricular systolic dysfunction.
Click here for a more detailed ECG

ECG 4c. Above is his ECG which was recorded 8 months later.
ST segment elevation is not seen any more. However, negative T waves still persist.
On the same day, his high-sensitive cardiac Troponin-I level was still high (1.59 ng/mL).
Repeated ECHOcardiography still showed mild left ventricular systolic dysfunction.
Click here for a more detailed ECG

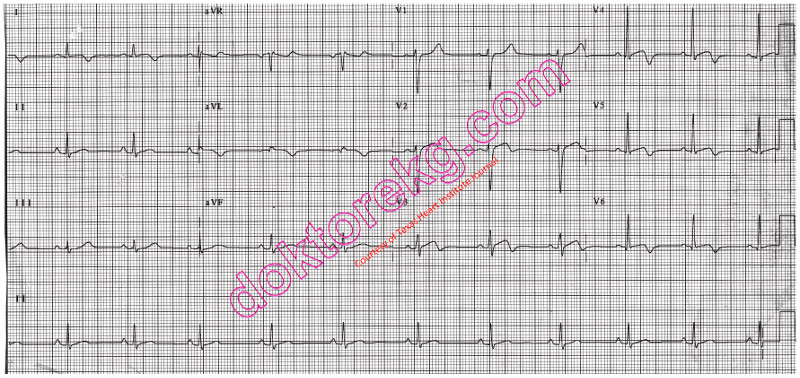
ECG 5a. The ECG above is from a 19 years-old man with chest pain and cardiac Troponin I elevation.
Coronary angiography showed normal coronary arteries.
Negative T waves in inferior leads are due to myocarditis, not myocardial ichemia.
Click here for a more detailed ECG

ECG 5b. Above ECG belongs to the same patient. It was recorded 12 months after the ECG 5a.
He does not have active myocarditis.
Inferior leads do not show T wave negativity.
Click here for a more detailed ECG

ECG 6. The ECG above belongs to a man with myocarditis.
Most of the leads show ST segment elevation and tall T waves.
His cardiac Troponin level was elevated. Coronary angiography showed normal coronary arteries.
Myocarditis was diagnosed.
Prof. Dr. Hakan Gullu has donated the above ECG to our website.
Click here for a more detailed ECG
There is no electrocardiographic sign specific to myocarditis.
Generally pericarditis accompanies the myocarditis.
A normal ECG does not exclude the diagnosis of myocarditis.
ECG abnormalities that may be observed in patients with myocarditis / myopericarditis
Sinus tachycardia
Diffuse T wave inversion
Atrioventricular (AV) blocks
QT interval prolongation
Bundle branch blocks
Ventricular arrhythmias
Abnormal (pathological) Q waves
ST segment elevation mimicking acute myocardial infarction (rare)
Sick sinus syndrome (rare)
ECG and prognosis in myocarditis
A gradual increase in the width of QRS complex is suggested as a sign of exacerbation of myocarditis.
Prolonged QRS duration is suggested as an independent predictor for cardiac death or heart transplantation in patients with suspected myocarditis.
References
Anadolu Kardiyol Derg 2012;12:279-280 .
Tex Heart Inst J 2011;38:288-290.
Circ J 2011;75:932-938.
Can J Cardiol 2011;27:870.e1-3. Epub 2011 Oct 15
Cardiol J 2011;18:552-555.
Circ J 2011;75:734-743.
Eur J Heart Fail 2011;13:398-405.
Int J Cardiol 2011 Aug 31. [Epub ahead of print]. DOI: http://dx.doi.org/10.1016/j.ijcard.2011.07.090
Am Heart Journal 1994;127:1290.
ECG 1. The ECG above belongs to a 34 years-old woman who was diagnosed as having diphtheria myocarditis.
ST segment is elevated in leads III, aVR, and V1 while it is depressed in other leads. A VPC is also seen.
Complete AV block developes after the VPC and nodal rhythm with P waves unrelated to the QRS complexes
(the last two beats) ensues.
Click here for a more detailed ECG
The ECG above has been used with the permission of Anatolian Journal of Cardiology and AVES Publishing.
Click here to read the relevant article of Dr. Ornek et al.
ECG 2. The ECG above belongs to a 20 years-old man who had developed myopericarditis after inhalation of the butane gas.
Widespread ST segment elevation is seen.
His cardiac Troponin I level increased up to 3.5 ng/mL. Coronary angiography revealed normal coronary arteries.
Click here for a more detailed ECG
The ECG above has been used with the permission of Anatolian Journal of Cardiology and AVES Publishing.
Click here to read the relevant article of Dr. Bayar et al.
ECG 3a. The ECG above is from a 17 years-old boy with varicella infection, severe chest pain and elevated cardiac enzymes.
The ST segment elevation in leads I, aVL, V4 to V6 suggests acute myocardial infarction at first glance.
His coronary angiography showed normal coronary arteries and varicella myopericarditis was diagnosed.
The ECG above has been used with the permission of Texas Heart Institute Journal.
Click here for a more detailed ECG
Click here to go to the relevant article of the Texas Heart Institute Journal
ECG 3b. His ECG at 5th day of hospitalization (before discharge) is seen above.
ST segments are nearly normal.
The ECG above has been used with the permission of Texas Heart Institute Journal.
Click here for a more detailed ECG
Click here to go to the relevant article of the Texas Heart Institute Journal
ECG 3c. Above is his ECG after 2 weeks. Negative T waves are seen in leads V3 to V6.
The ECG above has been used with the permission of Texas Heart Institute Journal.
Click here for a more detailed ECG
Click here to go to the relevant article of the Texas Heart Institute Journal
ECG 4a. The ECG above is from a 25 years-old man with chest pain and elevated cardiac enzymes.
At first glance, the ST segment elevation and T wave negativity in chest leads may suggest myocardial infarction.
Coronary angiography showed normal coronary arteries and myocarditis was diagnosed in this patient.
ECHOcardiography showed mild left ventricular systolic dysfunction.
Click here for a more detailed ECG
ECG 4b. Above is his ECG which was recorded 2 months later.
Chest leads show ST segment elevation (albeit less prominent) and negative T waves.
Repeated ECHOcardiography again showed mild left ventricular systolic dysfunction.
Click here for a more detailed ECG
ECG 4c. Above is his ECG which was recorded 8 months later.
ST segment elevation is not seen any more. However, negative T waves still persist.
On the same day, his high-sensitive cardiac Troponin-I level was still high (1.59 ng/mL).
Repeated ECHOcardiography still showed mild left ventricular systolic dysfunction.
Click here for a more detailed ECG
ECG 5a. The ECG above is from a 19 years-old man with chest pain and cardiac Troponin I elevation.
Coronary angiography showed normal coronary arteries.
Negative T waves in inferior leads are due to myocarditis, not myocardial ichemia.
Click here for a more detailed ECG
ECG 5b. Above ECG belongs to the same patient. It was recorded 12 months after the ECG 5a.
He does not have active myocarditis.
Inferior leads do not show T wave negativity.
Click here for a more detailed ECG
ECG 6. The ECG above belongs to a man with myocarditis.
Most of the leads show ST segment elevation and tall T waves.
His cardiac Troponin level was elevated. Coronary angiography showed normal coronary arteries.
Myocarditis was diagnosed.
Prof. Dr. Hakan Gullu has donated the above ECG to our website.
Click here for a more detailed ECG