d o t o r e g . c o m
Dr. Mete ALPASLAN
Left Atrial Abnormality
Diagnostic criteria
 There is notched or double peaked P wave in lead II.
The notch is due to the delay of left atrial activation.
There is notched or double peaked P wave in lead II.
The notch is due to the delay of left atrial activation.
The P wave duration is generally > 120ms (normal P wave duration should be < 120ms).
Observation of completely negative P wave in lead C1 (V1) supports the diagnosis of left atrial abnormality.
Clinical importance
Left atrial dilatation favours the development of atrial fibrillation.
About terminology
In the past, several terms like P mitrale, left atrial dilatation, left atrial hypertrophy, atrial overload were also used. However, the above described ECG findings are not limited to subjects with atrial muscle hypertrophy, but may also be observed in the presence of atrial pressure overload, ventricular diastolic dysfunction or intraatrial conduction delay. Therefore, the term left atrial abnormality should be used.
Reference
Circulation 2009,119:e251-e261.

ECG 1. In a patient with mitral stenosis (mitral valve ares 1.5 cm2), the observation of notched P waves in leads D2, D3 and
aVF suggests left atrial abnormality. The third QRS complex from the left is caused by an atrial premature beat which has
deformed the T wave .
Click here for a more detailed ECG

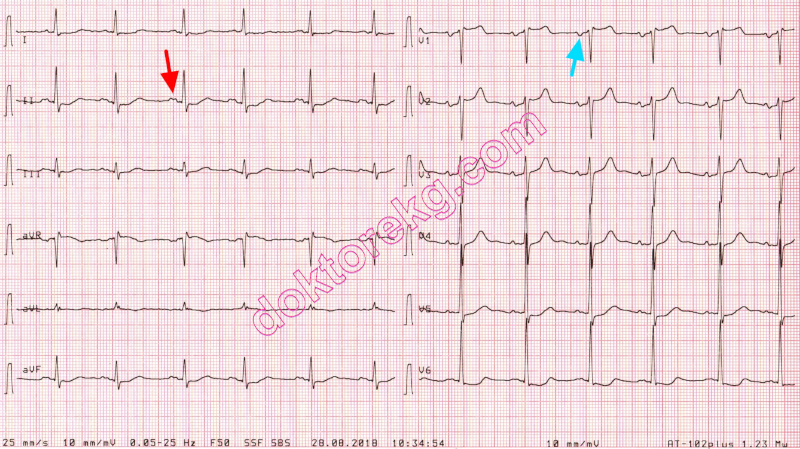
ECG 2. In another patient with left atrial dilatation nothched P waves in lead II with accompanying negative P waves in lead C1
(V1) are observed.
Click here for a more detailed ECG

ECG 3. The ECG above belongs to a 23 years-old woman with mild mitral stenosis and regurgitation. The tall and peaked
P waves in lead II show rigth atrial abnormality , In right precordial leads, the first half denotes to right atrial depolarization
while the second half denotes to left atrial depolarization .
Left atrial abnormality due to mitral stenosis caused double peaked P waves in leads V2 and V3.
Click here for a more detailed ECG

ECG 4. The ECG above belongs to a 66 years-old man with mitral stenosis.
The configuration of the P waves in leads II and V1 are typical for left atrial abnormality.
Click here for a more detailed ECG

ECG 5. The ECG above belongs to a 38 years-old woman with mitral stenosis and anemia.
The large negative component of the P wave in lead V1 is typical for left atrial abnormality.
Click here for a more detailed ECG

ECG 6. The ECG above is from a 52 years-old man who had undergone mitral valve replacement for severe mitral stenosis.
The above ECG was recorded 1 month after the operation. Left atrial enlargement is expected in severe mitral stenosis.
Negative component of the P wave in lead V1 suggests left atrial abnormality.
In the presence of atrial premature beats, P waves may lack the negative component.
Click here for a more detailed ECG
ECG 7a. The ECG above belongs to a 68 years-old man with chronic renal failure and hypertension.
ECHOcardiography showed a dilated left atrium (4.7 cm).
At a standard calibration of 10 mm/mV, this ECG shows signs of left atrial abnormality:
Lead II shows notched (double peaked) P wave while lead V1 shows P waves with prominent terminal negativity.
Click here for a more detailed ECG

ECG 7b. The ECG above belongs to the same man. It was recorded immediately before the ECG 7a.
To show P wave changes better, it was recorded at a calibration of 20 mm/mV.
This ECG shows signs of left atrial abnormality:
Lead II shows notched (double peaked) P wave while lead V1 shows P waves with prominent terminal negativity.
Click here for a more detailed ECG
There is notched or double peaked P wave in lead II.
The notch is due to the delay of left atrial activation.
The P wave duration is generally > 120ms (normal P wave duration should be < 120ms).
Observation of completely negative P wave in lead C1 (V1) supports the diagnosis of left atrial abnormality.
Clinical importance
Left atrial dilatation favours the development of atrial fibrillation.
About terminology
In the past, several terms like P mitrale, left atrial dilatation, left atrial hypertrophy, atrial overload were also used. However, the above described ECG findings are not limited to subjects with atrial muscle hypertrophy, but may also be observed in the presence of atrial pressure overload, ventricular diastolic dysfunction or intraatrial conduction delay. Therefore, the term left atrial abnormality should be used.
Reference
Circulation 2009,119:e251-e261.
ECG 1. In a patient with mitral stenosis (mitral valve ares 1.5 cm2), the observation of notched P waves in leads D2, D3 and
aVF suggests left atrial abnormality. The third QRS complex from the left is caused by an atrial premature beat which has
deformed the T wave .
Click here for a more detailed ECG
ECG 2. In another patient with left atrial dilatation nothched P waves in lead II with accompanying negative P waves in lead C1
(V1) are observed.
Click here for a more detailed ECG
ECG 3. The ECG above belongs to a 23 years-old woman with mild mitral stenosis and regurgitation. The tall and peaked
P waves in lead II show rigth atrial abnormality , In right precordial leads, the first half denotes to right atrial depolarization
while the second half denotes to left atrial depolarization .
Left atrial abnormality due to mitral stenosis caused double peaked P waves in leads V2 and V3.
Click here for a more detailed ECG
ECG 4. The ECG above belongs to a 66 years-old man with mitral stenosis.
The configuration of the P waves in leads II and V1 are typical for left atrial abnormality.
Click here for a more detailed ECG
ECG 5. The ECG above belongs to a 38 years-old woman with mitral stenosis and anemia.
The large negative component of the P wave in lead V1 is typical for left atrial abnormality.
Click here for a more detailed ECG
ECG 6. The ECG above is from a 52 years-old man who had undergone mitral valve replacement for severe mitral stenosis.
The above ECG was recorded 1 month after the operation. Left atrial enlargement is expected in severe mitral stenosis.
Negative component of the P wave in lead V1 suggests left atrial abnormality.
In the presence of atrial premature beats, P waves may lack the negative component.
Click here for a more detailed ECG
ECG 7a. The ECG above belongs to a 68 years-old man with chronic renal failure and hypertension.
ECHOcardiography showed a dilated left atrium (4.7 cm).
At a standard calibration of 10 mm/mV, this ECG shows signs of left atrial abnormality:
Lead II shows notched (double peaked) P wave while lead V1 shows P waves with prominent terminal negativity.
Click here for a more detailed ECG
ECG 7b. The ECG above belongs to the same man. It was recorded immediately before the ECG 7a.
To show P wave changes better, it was recorded at a calibration of 20 mm/mV.
This ECG shows signs of left atrial abnormality:
Lead II shows notched (double peaked) P wave while lead V1 shows P waves with prominent terminal negativity.
Click here for a more detailed ECG