d o t o r e g . c o m
Dr. Mete ALPASLAN
Atypical Electrocardiographic Presentation of Myocardial Infarction
 Classically, acute myocardial infarction results in heightened T waves, ST segment elevation, appearance of Q waves, normalization of ST segment and appearance of negative T waves sequentially.
However, not all patients follow this sequence.
In some patients, ST segment elevation may be less than 1 mm during the acute phase.
The patient's typical symptoms, cardiac enzyme levels and echocardiography results should also be considered for early diagnosis and treatment of acute myocardial infarction.

ECG 1a. The ECG above belongs to a 50 years-old man. It was recorded at the 5th hour of typical retrosternal chest pain.
He was referred for coronary angiography beacuse of typical chest pain and increased levels of cardiac enzymes.
What are the ECG abnormalities?
Click here for a more detailed ECG

Figure 1a. Fifteen minutes after recording of the ECG 1a, coronary angiography was performed.
The intermediate coronary artery was totally occluded immediately after its origination.

Figure 1b. After PTCA (ballon angioplasty) and implantation of a 2.75x24mm
drug-eluting stent, the intermediate coronary artery was opened.
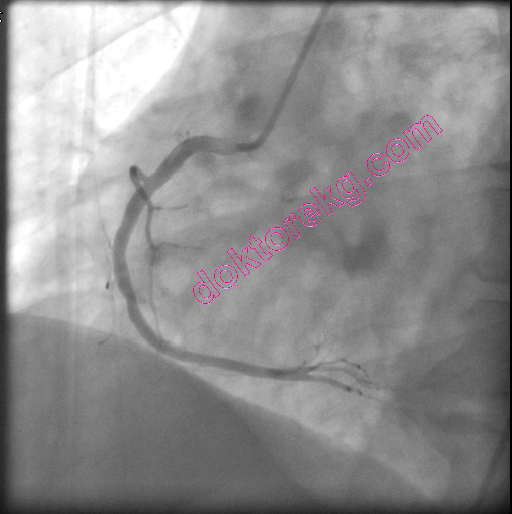
Figure 1c. No significant stenosis was observed in his right coronary artery.

The ECG above was recorded 15 minutes after successful stenting of the intermediate coronary artery.
Click here for a more detailed ECG

ECG 2a. The ECG above belongs to a 54 years-old man who complained of typical retrosternal chest pain.
It was recorded 2.5 hours after the onset of chest pain. No typical ECG sign of ischemia is seen.
He also has moderate mitral stenosis with a mitral valve area of 1.3cm2.
Click here for a more detailed ECG

ECG 2b. His second ECG was obtained 90 minutes after recording of the ECG 2a.
No ST segment elevation, ST segment depression or T wave negativity to suggest myocadial iscemia.
Click here for a more detailed ECG

ECG 2c. His third ECG was recorded 5.5 hours after the onset of his chest pain.
Ten minutes later, coronary angiography was performed.
Click here for a more detailed ECG


Figure 2a.b. His left coronary arteriography did not show significant stenosis (left).
The right coronary arteriography showed that his right coronary artery was totally occluded at a very proximal site (right).


Figure 2c.d. The PTCA (balloon angioplasty) was not successful in opening the right coronary artery (left).
Stent implantation resulted in complete opening of the right coronary artery (right) after which his chest pain disappeared.

ECG 2d. The ECG above was recorded 15 minutes after stenting of his right coronary artery.
Click here for a more detailed ECG
ECG 2e. The ECG above was recorded 15 hours after stenting of his right coronary artery.
(Arm leads reversed)
At this time, his cardiac Troponin I level was above normal.
By looking at this ECG, who can say that he had complete occlusion of a dominant right coronary artery one day before?
Click here for a more detailed ECG

ECG 3a. The ECG above belongs to a 70 years-old woman who was admitted to the emergency room with the complaint of
retrosternal chest pain. There is no typical ECG sign of acute myocardial infarction. At most, the T wave in leads V2 and V3
may be accepted to be taller than expected (when compared with the amplitude of the QRS complex).
Her cardiac enzymes were elevated. Ten minutes after recording of the above ECG, she was taken to the cardiac
catheterization laboratory.
Click here for a more detailed ECG


Figure 3a (Left).3b (Right). Her coronary angiography showed that the LAD was occluded just after giving the first Diagonal
branch. The Diagonal branch had a significant but subtotal occlusion.
The Obtus marginale branch of the circumflex (Cx) artery was occluded proximally (left).
The right coronary arteriography was normal and the LAD was filling retrogradely (right).
This suggested acute total occlusion of the Obtus branch and chronic total occlusion of the LAD.

Figure 3c. The left coronary angiogram above was recorded
after PTCA and stenting of the Obtus marginale.

ECG 3b. The ECG above was recorded 2 days after stenting of the Obtus marginale branch of the Cx artery.
Now, the amplitude of the T wave in leads V2 and V3 are lesser.
Click here for a more detailed ECG

ECG 4a. The ECG above belongs to a 51 years-old man complaining of "stomach pain". It was recorded in the Emeregncy Room.
Inferior and lateral leads show ST depression while lead aVR shows ST elevation.
ST elevation and tall T waves are seen in leads V1 and V2.
The patient requested a medicine for his "stomach pain" and wanted to go home.
It was difficult to persuade him for urgent coronary angiography.
Fifteen minutes after recording of the above ECG, he underwent urgent coronary angiography which showed total occlusion of the
Left Anterior Descending (LAD) coronary artery. His Right Coronary Artery (RCA) and Circumflex (Cx) coronary arteries
also showed significant stenoses (BELOW).
Click here for a more detailed ECG


Figure 4a (LEFT). Left coronary angiogram showed proximal total occlusion of the LAD .
Intermediary artery was normal. Not all people have an intermediary artery.
A patient with an intermediary artery will have less left ventricular damage during acute anterior myocardial infarction.
After giving the Obtus marginale branch, 2 significant stenoses are seen in his Cx artery.
Figure 4b (RIGHT). Left coronary angiogram after stenting of the LAD is seen on the right side, above.

Figure 4c. The same patient's right coronary angiogram showed
significant stenosis of the right ventricular branch of the RCA.

ECG 4b. The same patient's ECG, 12 hours after stenting of the LAD is seen above.
Click here for a more detailed ECG

ECG 5a. The ECG above belongs to a 44 years-old man complaining of retrosternal chest oppression.
He came to the Cardiology outpatient clinic with the above ECG.
What is your diagnosis?
Click here for a more detailed ECG
ECG 5b Inferior leads show minimal ST segment elevation: acute inferior wall myocardial infarction.
Emergency coronary angiography was performed. Distal Circumflex (Cx) coronary artery was totally occluded.
Click here for a more detailed ECG

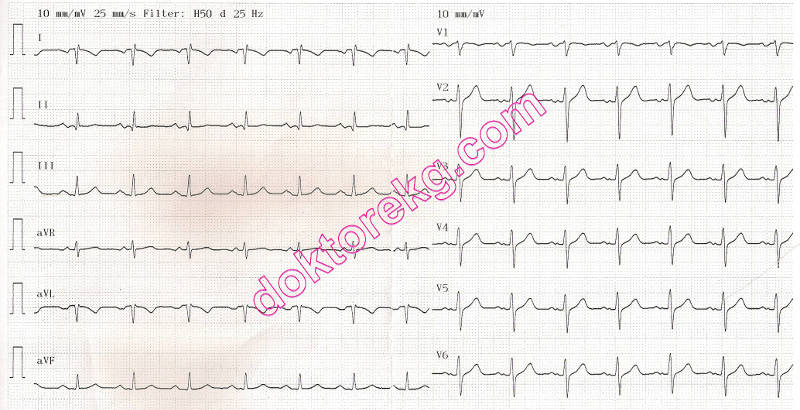
ECG 6a. The ECG above belongs to a 60 years-old man with old infero-postero-lateral myocardial infarction.
His ECHOcardiography showed hypokinesia of inferior, posterior and lateral walls of the left ventricle
with an ejection fraction of 38% (left ventricular systolic dysfunction).
Do you see any abnormality in this ECG?
Click here for a more detailed ECG

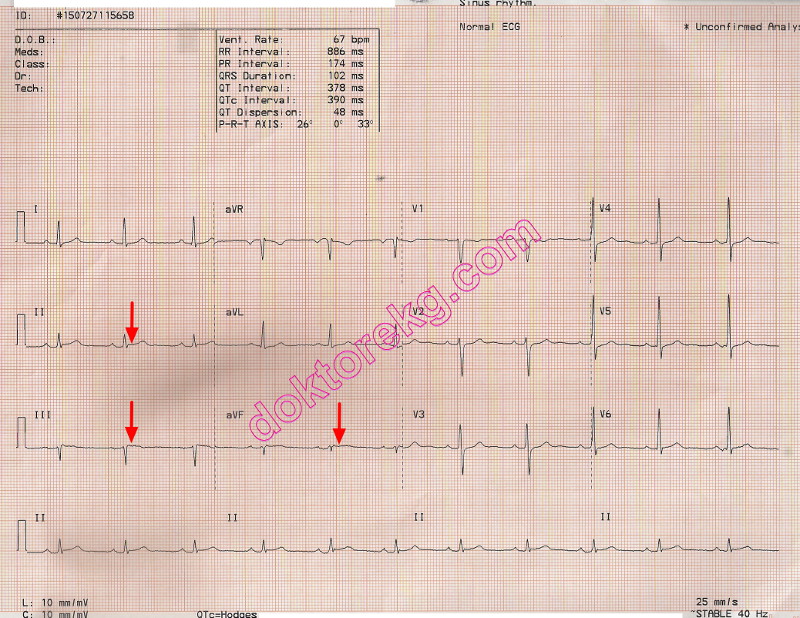
ECG 6b. The compact ECG above is the summary report of ECG 6a. The ECG's computer also reported it as "normal".
Classically, acute myocardial infarction results in heightened T waves, ST segment elevation, appearance of Q waves, normalization of ST segment and appearance of negative T waves sequentially.
However, not all patients follow this sequence.
In some patients, ST segment elevation may be less than 1 mm during the acute phase.
The patient's typical symptoms, cardiac enzyme levels and echocardiography results should also be considered for early diagnosis and treatment of acute myocardial infarction.
ECG 1a. The ECG above belongs to a 50 years-old man. It was recorded at the 5th hour of typical retrosternal chest pain.
He was referred for coronary angiography beacuse of typical chest pain and increased levels of cardiac enzymes.
What are the ECG abnormalities?
Click here for a more detailed ECG
Figure 1a. Fifteen minutes after recording of the ECG 1a, coronary angiography was performed.
The intermediate coronary artery was totally occluded immediately after its origination.
Figure 1b. After PTCA (ballon angioplasty) and implantation of a 2.75x24mm
drug-eluting stent, the intermediate coronary artery was opened.
Figure 1c. No significant stenosis was observed in his right coronary artery.
The ECG above was recorded 15 minutes after successful stenting of the intermediate coronary artery.
Click here for a more detailed ECG
ECG 2a. The ECG above belongs to a 54 years-old man who complained of typical retrosternal chest pain.
It was recorded 2.5 hours after the onset of chest pain. No typical ECG sign of ischemia is seen.
He also has moderate mitral stenosis with a mitral valve area of 1.3cm2.
Click here for a more detailed ECG
ECG 2b. His second ECG was obtained 90 minutes after recording of the ECG 2a.
No ST segment elevation, ST segment depression or T wave negativity to suggest myocadial iscemia.
Click here for a more detailed ECG
ECG 2c. His third ECG was recorded 5.5 hours after the onset of his chest pain.
Ten minutes later, coronary angiography was performed.
Click here for a more detailed ECG
Figure 2a.b. His left coronary arteriography did not show significant stenosis (left).
The right coronary arteriography showed that his right coronary artery was totally occluded at a very proximal site (right).
Figure 2c.d. The PTCA (balloon angioplasty) was not successful in opening the right coronary artery (left).
Stent implantation resulted in complete opening of the right coronary artery (right) after which his chest pain disappeared.
ECG 2d. The ECG above was recorded 15 minutes after stenting of his right coronary artery.
Click here for a more detailed ECG
ECG 2e. The ECG above was recorded 15 hours after stenting of his right coronary artery.
(Arm leads reversed)
At this time, his cardiac Troponin I level was above normal.
By looking at this ECG, who can say that he had complete occlusion of a dominant right coronary artery one day before?
Click here for a more detailed ECG
ECG 3a. The ECG above belongs to a 70 years-old woman who was admitted to the emergency room with the complaint of
retrosternal chest pain. There is no typical ECG sign of acute myocardial infarction. At most, the T wave in leads V2 and V3
may be accepted to be taller than expected (when compared with the amplitude of the QRS complex).
Her cardiac enzymes were elevated. Ten minutes after recording of the above ECG, she was taken to the cardiac
catheterization laboratory.
Click here for a more detailed ECG
Figure 3a (Left).3b (Right). Her coronary angiography showed that the LAD was occluded just after giving the first Diagonal
branch. The Diagonal branch had a significant but subtotal occlusion.
The Obtus marginale branch of the circumflex (Cx) artery was occluded proximally (left).
The right coronary arteriography was normal and the LAD was filling retrogradely (right).
This suggested acute total occlusion of the Obtus branch and chronic total occlusion of the LAD.
Figure 3c. The left coronary angiogram above was recorded
after PTCA and stenting of the Obtus marginale.
ECG 3b. The ECG above was recorded 2 days after stenting of the Obtus marginale branch of the Cx artery.
Now, the amplitude of the T wave in leads V2 and V3 are lesser.
Click here for a more detailed ECG
ECG 4a. The ECG above belongs to a 51 years-old man complaining of "stomach pain". It was recorded in the Emeregncy Room.
Inferior and lateral leads show ST depression while lead aVR shows ST elevation.
ST elevation and tall T waves are seen in leads V1 and V2.
The patient requested a medicine for his "stomach pain" and wanted to go home.
It was difficult to persuade him for urgent coronary angiography.
Fifteen minutes after recording of the above ECG, he underwent urgent coronary angiography which showed total occlusion of the
Left Anterior Descending (LAD) coronary artery. His Right Coronary Artery (RCA) and Circumflex (Cx) coronary arteries
also showed significant stenoses (BELOW).
Click here for a more detailed ECG
Figure 4a (LEFT). Left coronary angiogram showed proximal total occlusion of the LAD .
Intermediary artery was normal. Not all people have an intermediary artery.
A patient with an intermediary artery will have less left ventricular damage during acute anterior myocardial infarction.
After giving the Obtus marginale branch, 2 significant stenoses are seen in his Cx artery.
Figure 4b (RIGHT). Left coronary angiogram after stenting of the LAD is seen on the right side, above.
Figure 4c. The same patient's right coronary angiogram showed
significant stenosis of the right ventricular branch of the RCA.
ECG 4b. The same patient's ECG, 12 hours after stenting of the LAD is seen above.
Click here for a more detailed ECG
ECG 5a. The ECG above belongs to a 44 years-old man complaining of retrosternal chest oppression.
He came to the Cardiology outpatient clinic with the above ECG.
What is your diagnosis?
Click here for a more detailed ECG
ECG 5b Inferior leads show minimal ST segment elevation: acute inferior wall myocardial infarction.
Emergency coronary angiography was performed. Distal Circumflex (Cx) coronary artery was totally occluded.
Click here for a more detailed ECG
ECG 6a. The ECG above belongs to a 60 years-old man with old infero-postero-lateral myocardial infarction.
His ECHOcardiography showed hypokinesia of inferior, posterior and lateral walls of the left ventricle
with an ejection fraction of 38% (left ventricular systolic dysfunction).
Do you see any abnormality in this ECG?
Click here for a more detailed ECG
ECG 6b. The compact ECG above is the summary report of ECG 6a. The ECG's computer also reported it as "normal".